


Looking through the ONS figures on tax, there are lots of useful numbers to consider.
The richest fifth of households paid £29,800 in taxes (direct and indirect) compared with £5,200 for the poorest fifth.
In 2014/15, 50.8% of all households received more in benefits (including benefits in kind) than they paid in taxes, equivalent to 13.6 million households. This continues the downward trend seen since 2010/11 (53.5%), but remains above the proportion seen before the economic downturn.
On average, households whose head was between 25 and 64 paid more in taxes than they received in benefits (including in-kind benefits) in 2014/15, whilst the reverse was true for those aged 65 and over, as the state pension starts to kick in, the largest single component of the welfare bill in the UK.
Analysis on changes in median household disposable income and other related measures, which used to form part of this report, were published earlier this year in “Household Disposable Income and Inequality, financial year ending 2015”. It looks at the various stages of redistribution of income:
Figure 1: Stages in the redistribution of income
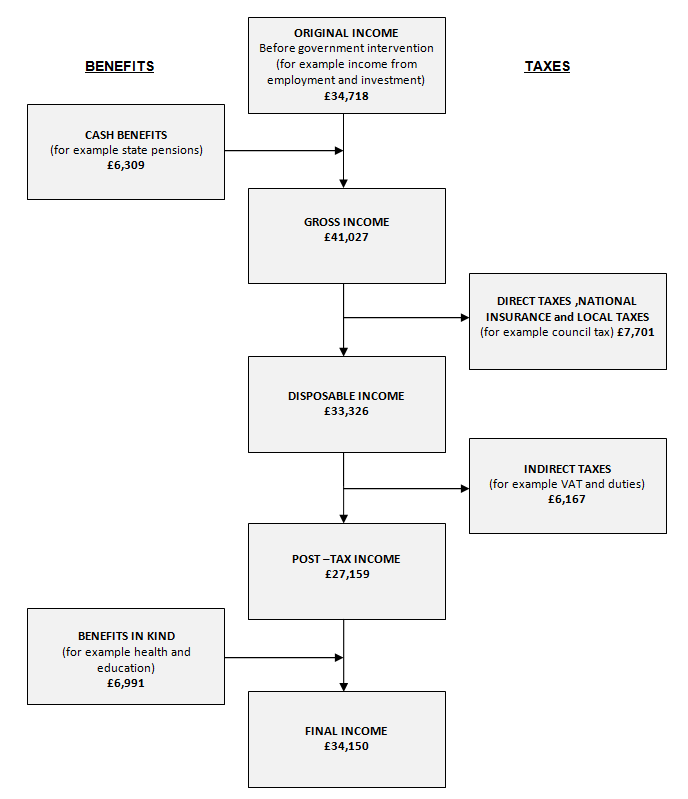
Source: Office for National Statistics
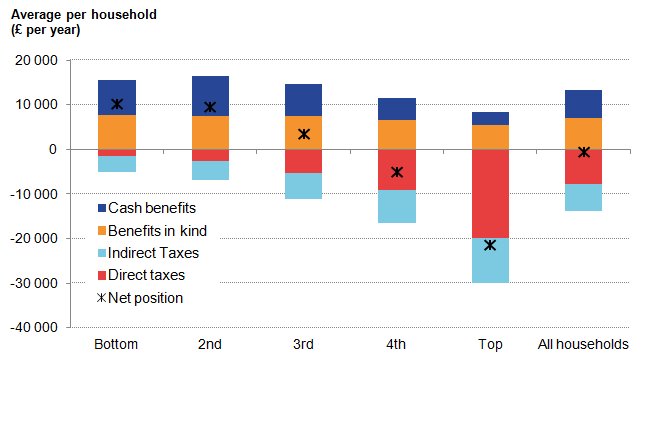
The overall impact of taxes and benefits (especially the latter) are that they lead to income being shared more equally between households.
Figure 2: Summary of the effects of taxes and benefits by quintile groups, ALL households, financial year ending 2015, UK
Looking at individual cash benefits, in 2014/15, the average combined amount of contribution-based and income-based Jobseeker’s Allowance (JSA) received by the bottom 2 quintile groups decreased, consistent with a fall in unemployment, as well as the ongoing implementation of the Universal Credit (UC) system.
Claimants of UC and JSA are subject to the Claimant Commitment which outlines specific actions that the recipient must carry out in order to receive benefits. This may also have affected the number of households in receipt of these benefits. JSA rates, along with other working age benefits, were increased by 1% in 2014/15, below the CPI rate of inflation. The phasing out of Incapacity Benefit, Severe Disablement Allowance and Income Support paid because of illness or disability and transfer of recipients to Employment and Support Allowance (ESA) has seen average amounts received from the former benefits fall in 2014/15, whilst average amounts received from ESA have risen, reflecting the increased number of claimants.
The roll-out of Personal Independence Payment (PIP), which is replacing Disability Living Allowance (DLA) for adults aged under 65, also continued in 2014/15.
We are told that these rollouts and replacements are not cost-cutting exercises, that the government is not deliberately targeting benefits to the ill and disabled, yet that does seem to be their impact.
There was a 20.3% decrease in the amount of Child Benefit received by the richest fifth of households, due to fewer households in this part of the income distribution receiving this benefit. This is likely to be related to the High Income Benefit Charge, which may have resulted in some households electing to stop getting Child Benefit (“opt out”) rather than pay the charge. Since Child Benefit claims process is linked to my on-going entitlement to the State pension (Carers’ Allowance) , we decided to continue to claim and re-pay the tax.
Direct taxes (Income Tax, employees’ National Insurance contributions and Council Tax or Northern Ireland rates) also act to reduce inequality of income. Richer households pay both higher amounts of direct tax and a higher proportion of their income in direct taxes.
The majority of this (16.3% of gross income) was paid in Income Tax. The average tax bill for the poorest fifth of households, by contrast was equivalent to 11.0% of their gross household income. Council Tax or Northern Ireland rates made up the largest proportion of direct taxes for this group, accounting for half of all direct taxes paid by them, 5.5% of their gross income on average.
The amount of indirect tax (such as Value Added Tax (VAT) and duties on alcohol and fuel) each household pays is determined by their expenditure rather than their income. The richest fifth of households paid just over 2 and a half times as much in indirect taxes as the poorest fifth (£10,000 and £3,700 per year, respectively). This reflects greater expenditure on goods and services subject to these taxes by higher income households.
However, although richer households pay more in indirect taxes than poorer ones, they pay less as a proportion of their income (Figure 5).
This means that indirect taxes increase inequality of income.
Today, Theresa May has committed to not increasing VAT in the forthcoming parliament though obviously the highest rate set is already far in excess of the EU minimum. She obviously hasn’t committed to not extending the reach of VAT, to move more consumer goods into the VAT charge rate.
In 2014/15, the richest fifth of households paid 15.0% of their disposable income in indirect taxes, while the bottom fifth of households paid the equivalent of 29.7% of their disposable income. Across the board, VAT is the largest component of indirect taxes. Again, the proportion of disposable income that is spent on VAT is highest for the poorest fifth and lowest for the richest fifth.ce for National Statistics
Grouping households by their income is recognised as the standard approach to distributional analysis, as income provides a good indication of households’ material living standards, but it is also useful to group households according to their expenditure, particularly for examining indirect taxes, which are paid on expenditure rather than income. Some households, particularly those at the lower end of the income distribution, may have annual expenditure which exceeds their annual income. For these households, their expenditure is not being funded entirely from income. During periods of low income, these households may maintain their standard of living by funding their expenditure from savings or borrowing, thereby adjusting their lifetime consumption.
When expressed as a percentage of expenditure, the proportion paid in indirect tax declines less sharply as income rises (Figure 6) compared with the level of indirect taxes paid as a proportion of household disposable income. The bottom fifth of households paid 20.1% of their expenditure in indirect taxes compared with 17.6% for the top fifth. These figures are broadly unchanged from the previous year.
After indirect taxes, the richest fifth had post-tax household incomes that were 6 and a half times those of the poorest fifth (£56,900 compared with £8,700 per year, respectively). This ratio is unchanged on 2013/14.
The ONS also considered the effect on household income of certain benefits received in kind. Benefits in kind are goods and services provided by the government to households that are either free at the time of use or at subsidised prices, such as education and health services. These goods and services can be assigned a monetary value based on the cost to the government which is then allocated as a benefit to individual households. The poorest fifth of households received the equivalent of £7,800 per year from all benefits in kind, compared with £5,500 received by the top fifth (Effects of taxes and benefits dataset Table 2). This is partly due to households towards the bottom of the income distribution having, on average, a larger number of children in state education.
Overall, in 2014/15, 50.8% of all households received more in benefits (including in-kind benefits such as education) than they paid in taxes (direct and indirect) (Figure 7). This equates to 13.6 million households. This continues the downward trend seen since 2010/11 (53.5%) but remains above the proportions seen before the economic downturn.
The trend seen for non-retired households mirrors that for all households, except that lower percentages of non-retired households receive more in benefits than pay in taxes, 36.9% in 2014/15, down from a peak of 39.7% in 2010/11.
In contrast, in 2014/15, 88.7% of retired households received more in benefits than paid in taxes, reflecting the classification of the State Pension as a cash benefit in this analysis. A retired household is defined as a household where the income of retired household members accounts for the majority of the total household gross income2. This figure is lower than its 2009/2010 peak of 92.4% but is broadly similar to the proportions seen before the downturn.
There are a number of different ways in which inequality of household income can be presented and summarised. Perhaps the most widely used measure internationally is the Gini coefficient. Gini coefficients can vary between 0 and 100 and the lower the value, the more equally household income is distributed.
The extent to which cash benefits, direct taxes and indirect taxes together work to affect income inequality can be seen by comparing the Gini coefficients of original, gross, disposable and post-tax incomes (Effects of taxes and benefits dataset Table 10). Cash benefits have the largest impact on reducing income inequality, in 2014/15 reducing the Gini coefficient from 50.0% for original income to 35.8% for gross income (Figure 8). Direct taxes act to further reduce it, to 32.6% in 2014/15. However, indirect taxes have the opposite effect and in 2014/15 the Gini for post-tax income was 36.4%, meaning that overall, taxes have a negligible effect on income inequality.
Figure 3: Gini Coefficient impact of taxes and benefits
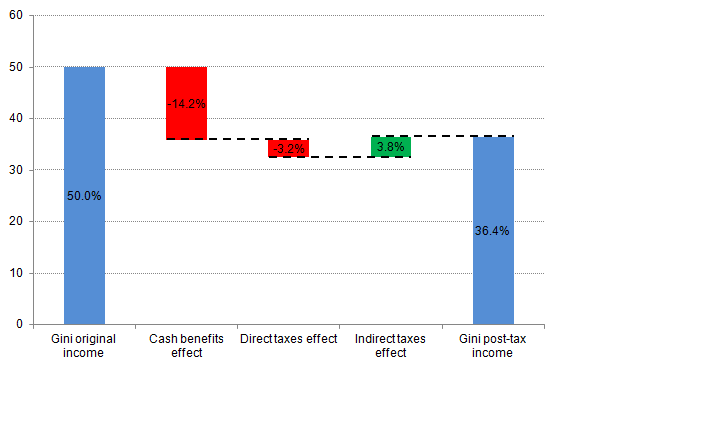
Source: Office for National Statistics